Getting Started
Linkerd works by installing ultralight proxies intoeach pod of a service. These proxies become part of a data plane which reports telemetry data to, and receivessignals from, a control plane. This meansthat using Linkerd doesn’t require any code changes, and can even be installedlive on a running service.
To interact with Linkerd, you first install the control plane and then add thedata plane proxies to your service. Once installed, you can interact withLinkerd using:
The Linkerd dashboard.
Grafana dashboards configured for you, out of thebox.
From Prometheus itself.
In this guide, we’ll walk you through how to install the Linkerd onto yourKubernetes cluster and deploy a sample gRPC application to show offwhat Linkerd can do for your services.
Step 0: Setup
First, you’ll need a Kubernetes cluster running 1.9 or later, and a functioningkubectl command on your local machine.
To run Kubernetes on your local machine, we suggestMinikube— running version 0.24.1 or later. To see other options, check out thefull list.
When ready, make sure you’re running a recent version of Kubernetes with:
kubectl version --short
If you are using GKE with RBAC enabled, you will want to grant a ClusterRoleof cluster-admin to your Google Cloud account first. This will provide yourcurrent user all the permissions required to install the control plane. To bindthis ClusterRole to your user, you can run:
kubectl create clusterrolebinding cluster-admin-binding-$USER \--clusterrole=cluster-admin --user=$(gcloud config get-value account)
In the next step, we will install the CLI and validate that your cluster isready to install the control plane.
Step 1: Install the CLI
If this is your first time running Linkerd, you’ll need to download thecommand-line interface (CLI) onto your local machine. You’ll use this CLI tointeract with Linkerd, including installing the control plane onto yourKubernetes cluster.
To install the CLI, run:
curl -sL https://run.linkerd.io/install | sh
Alternatively, you can download the CLI directly via theLinkerd releases page.
Next, add linkerd to your path with:
export PATH=$PATH:$HOME/.linkerd2/bin
Verify the CLI is installed and running correctly with:
linkerd version
As we’ve not installed the control plane yet, the server’s version will beunavailable at this point.
Step 2: Validate your Kubernetes cluster
Kubernetes clusters can be configured in many different ways. To ensure that thecontrol plane will install correctly, the Linkerd CLI can check and validatethat everything is configured correctly.
To check that your cluster is configured correctly and ready to install thecontrol plane, you can run:
linkerd check --pre
Step 3: Install Linkerd onto the cluster
Now that you have the CLI running locally and a cluster that is ready to go,it’s time to install the lightweight control plane into its own namespace(linkerd). If you would like to install it into a different namespace, check outthe help for install. To do this, run:
linkerd install | kubectl apply -f -
linkerd install generates a list of Kubernetes resources. Run it standalone ifyou would like to understand what is going on. By piping the output of linkerd into
installkubectl, the Linkerd control plane resources will be added toyour cluster and start running immediately.
Depending on the speed of your internet connection, it may take a minute or twofor your Kubernetes cluster to pull the Linkerd images. While that’s happening,we can validate that everything’s happening correctly by running:
linkerd check
This command will patiently wait until Linkerd has been installed and isrunning. If you’re interested in what components were installed, you can run:
kubectl -n linkerd get deploy
Check out the architecture documentation for anin depth explanation of what these components are and what they do.
Step 4: Explore Linkerd
With the control plane installed and running, you can now view the Linkerddashboard by running:
linkerd dashboard

The control plane components all have the proxy installed in their pods and arepart of the data plane itself. This provides the ability to dig into thesecomponents and see what is going on behind the scenes. In fact, you can run:
linkerd -n linkerd top deploy/web
This is the traffic you’re generating by looking at the dashboard itself!
Step 5: Install the demo app
To get a feel for how Linkerd would work for one of your services, you caninstall the demo application. It provides an excellent place to look at all thefunctionality that Linkerd provides. To install it on your own cluster, in itsown namespace (emojivoto), run:
curl -sL https://run.linkerd.io/emojivoto.yml \| kubectl apply -f -
You can take a look at this by forwarding the web pod to localhost and lookingat the app in your browser. To forward web locally to port 8080, you can run:
kubectl -n emojivoto port-forward \$(kubectl -n emojivoto get po -l app=web-svc -oname | cut -d/ -f 2) \8080:80
You might notice that some parts of the application are broken! If you were toinspect your handy local Kubernetes dashboard, you wouldn’t see very much ofinterest — as far as Kubernetes is concerned, the app is running just fine.This is a very common situation! Kubernetes understands whether your pods arerunning, but not whether they are responding properly. Check out thedebugging example if you’re interested in how to figureout exactly what is wrong.
To get some added visibility into what is going on and see some of thefunctionality of Linkerd, let’s add Linkerd to emojivoto by running:
kubectl get -n emojivoto deploy -o yaml \| linkerd inject - \| kubectl apply -f -
This command retrieves all of the deployments running in the emojivoto namespace,runs the set of Kubernetes resources through inject, and finally reapplies it tothe cluster. inject augments the resources to include the data plane’sproxies. As with install, inject is a pure text operation, meaning that youcan inspect the input and output before you use it. You can even run it throughdiff to see exactly what is changing.
Once piped into kubectl apply, Kubernetes will execute a rolling deploy andupdate each pod with the data plane’s proxies, all without any downtime.
You’ve added Linkerd to existing services without touching the original YAML!Because inject augments YAML, it would also be possible to takeemojivoto.yml itself and do the same thing(cat emojivoto.yml | linkerd inject -).This is a great way to get Linkerd integrated into your CI/CDpipeline. You can choose which services use Linkerd one at a time andincrementally add them to the data plane.
Just like with the control plane, it is possible to verify that everything workedthe way it should with the data plane. To do this check, run:
linkerd -n emojivoto check --proxy
Step 6: Watch it run!
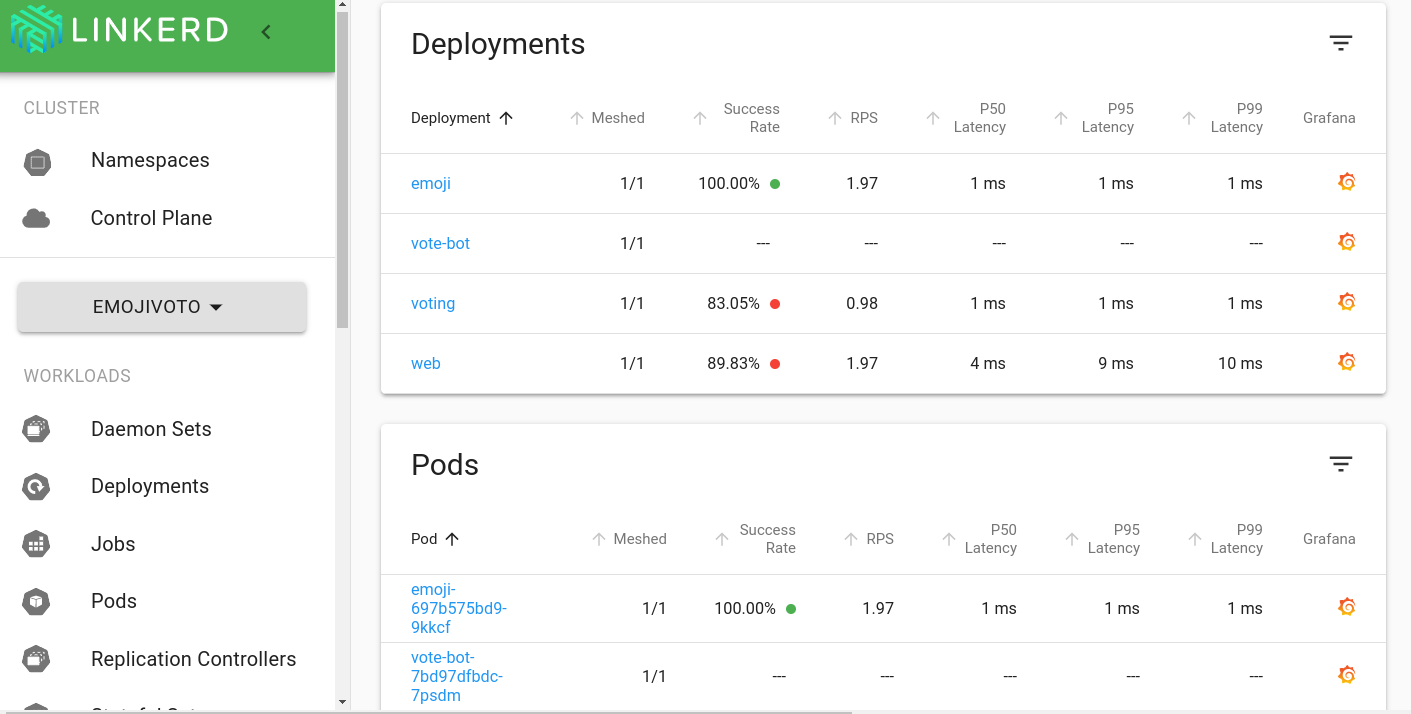
You can glance at the Linkerd dashboard and see all the HTTP/2 (gRPC) and HTTP/1(web frontend) speaking services in the demo app show up in the list ofresources running in the emojivoto namespace. As the demo app comes with aload generator, it is possible to check out some of the Linkerd functionality.
To see some high level stats about the app, you can run:
linkerd -n emojivoto stat deploy
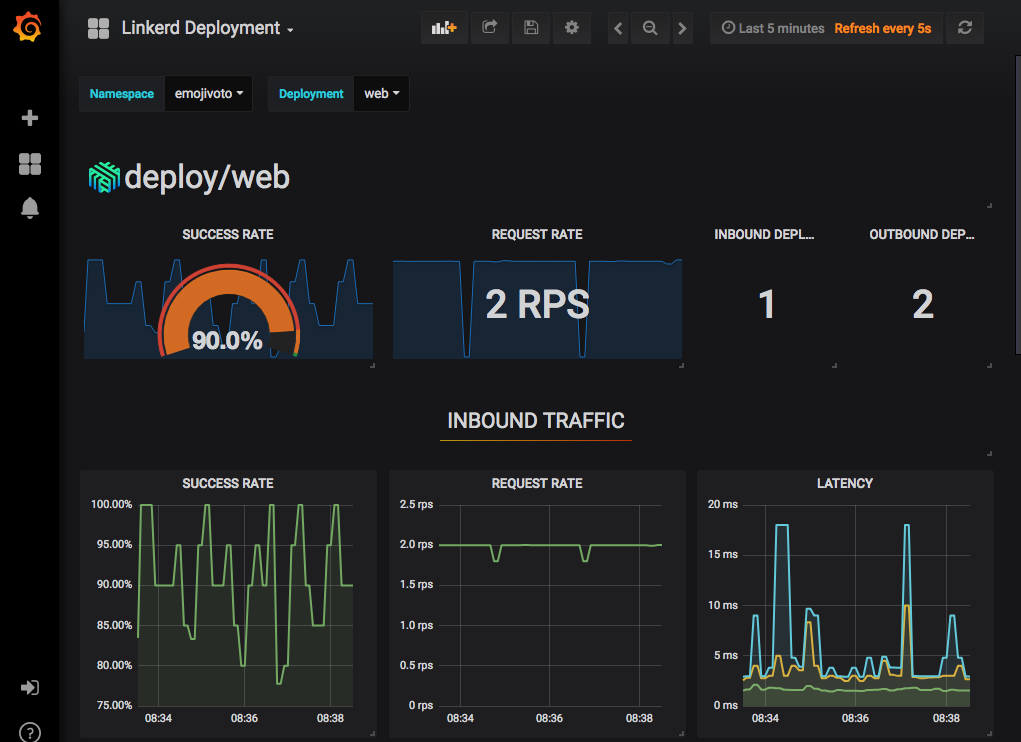
This will show the “golden” metrics for each deployment:
- Success rates
- Request rates
- Latency distribution percentiles
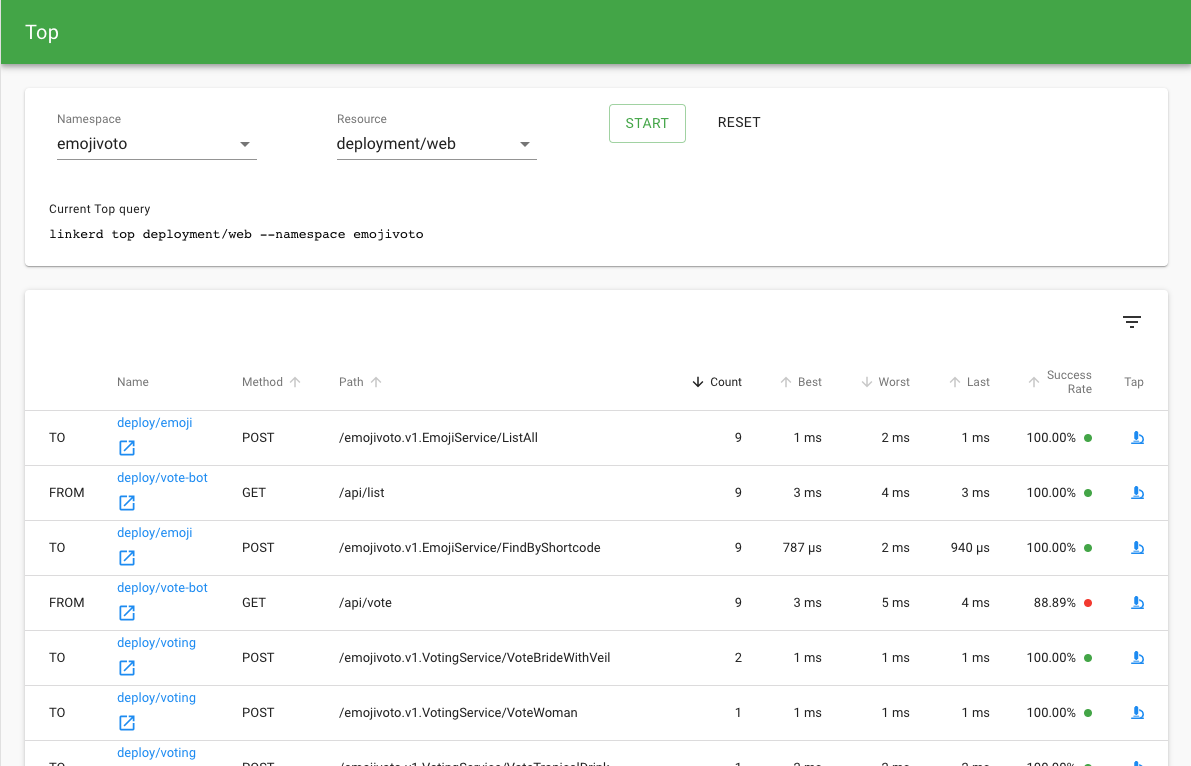
To dig in a little further, it is possible totopthe running services in realtime and get an idea of what is happening on a per-path basis. To see this, youcan run:
linkerd -n emojivoto top deploy
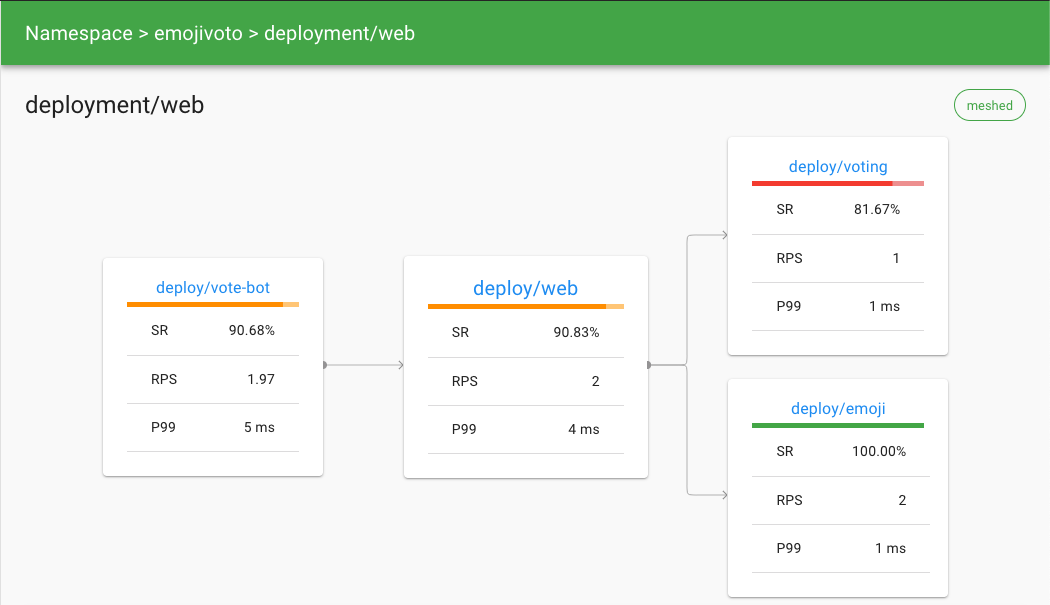
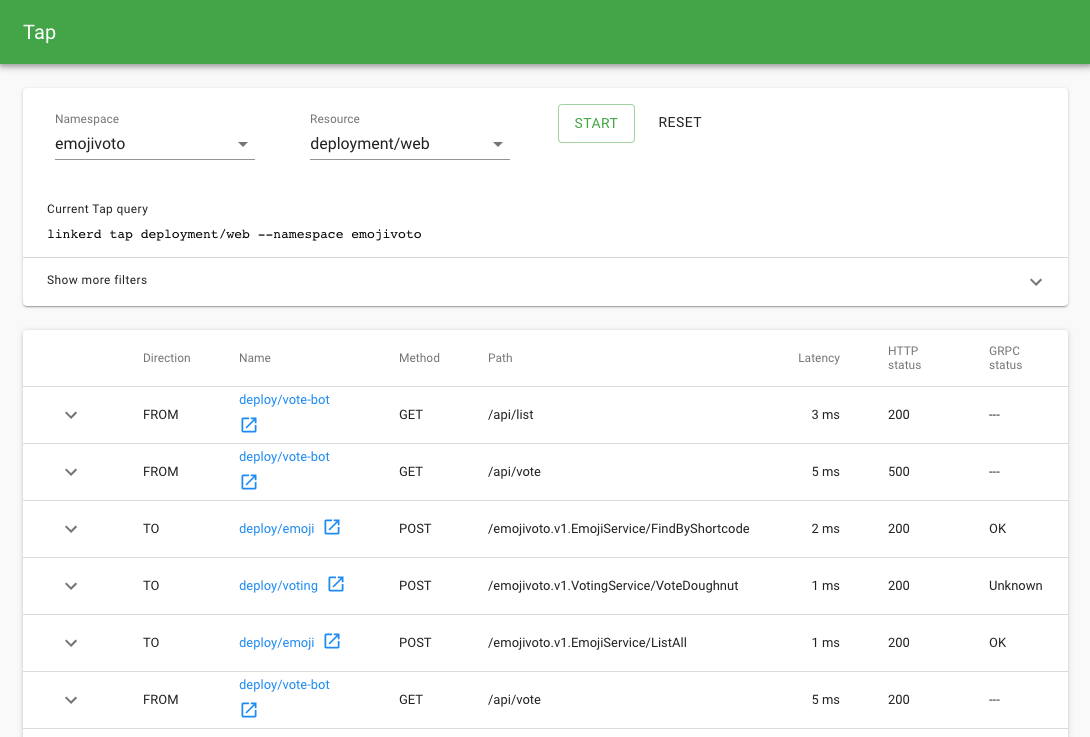
If you’re interested in going even deeper, tap shows the stream of requestsacross a single pod, deployment, or even everything in the emojivoto namespace.To see this stream for the web deployment, all you need to do is run:
linkerd -n emojivoto tap deploy/web
All of this is also available with the dashboard, if you would like to use yourbrowser instead. The dashboard views look like:
These are all great for seeing real time data, but what about things thathappened in the past? Linkerd includes Grafana to visualize all the greatmetrics collected by Prometheus and ships with some extremely valuabledashboards. You can get to these by clicking the Grafana icon in the overviewpage.
That’s it! ?
For more things you can do:
- Debug emojivoto
- Add Linkerd to your service
- Learn more about Linkerd’s architecture
- Hop into the #linkerd2 channel onthe Linkerd Slack